Rosewood Case Spreadsheet 4e3b6v
This document was ed by and they confirmed that they have the permission to share it. If you are author or own the copyright of this book, please report to us by using this report form. Report l4457
Overview 6h3y3j
& View Rosewood Case Spreadsheet as PDF for free.
More details h6z72
- Words: 577
- Pages: 5
Rosewood Hotels & Resorts: Customer Lifetime Value Analysis Harvard Business School Publishing Brief Case Teaching Note 2088 Teaching Note Software Copyright © 2007 Harvard Business School Publishing. To order copies or request permission to reproduce materials, call 1-800-545-7685, write Harvard Business School Publishing, Boston, MA 02163, or go to http://www.hbsp.harvard.edu. No part of this publication may be reproduced, stored in a retrieval system, used in a spreadsheet, or transmitted in any form or by any means—electronic, mechanical, photocopying, recording, or otherwise—without the permission of Harvard Business School Publishing
ROSEWOOD HOTELS & RESORTS: CUSTOMER LIFETIME VALUE (CLTV) ANALYSIS Inputs
Total Number of Unique Guests Average Daily Spend Number of Days Average Guest Stays per Stay Average Gross Margin per Room Average Number of Visits per Year per Guest Average Marketing Expense per Guest (system-wide) Average New Guest Acquisition Expense (system-wide) Total Number of Repeat Guests of which: Total Number of Multi-property Stay Guests Additional Costs Required per annum Discount Rate Average Guest Retention Rate
CLTV Calculation With No Changes to Brand Strategy Year Number of Nights per Stay Number of Stays per guest (assuming they are retained) Revenue Per Night Revenue per Customer Gross Profit per Customer Less Cost to Acquire Customer Less Annual Marketing Cost per Customer Cash Flow from Customer if Retained Probability of Being Retained Expected Cash Flow from Customer Discount Factor NPV of Expected Cash Flow from Customer Total NPV of CLTV CLTV Calculation With New Brand Strategy Year Number of Nights per Stay Number of Stays per guest (assuming they are retained) Revenue Per Night Revenue per Customer Gross Profit per Customer Less Cost to Acquire Customer Less Annual Marketing Cost per Customer Less Additional Marketing Cost per Customerb Cash Flow from Customer if Retained Probability of Being Retained
Expected Cash Flow from Customer Discount Factor NPV of Expected Cash Flow from Customer Total NPV of CLTV Increase in CLTV per customer of new Marketing Plan Multiplied by # of Customers to obtain increase in profit of Rosewood from new brand strategy Divided by 32% gross margin to obtain increase in Revenue of Rosewood from new brand strategy b
$1 million growing at 3% per year allocated to 115,000 guests
Without Rosewood With Rosewood Branding (2003) Corporate Branding Growth Rate 115,000 $750.00 2.0 32% 1.2 $130.00 $150.00 19,169 5,750
115,000 $750.00 2.0 32% 1.3 $138.70 $150.00 24,919 11500
8% 16.67%
8% 21.67%
2003
growing at
6%
growing at
3%
($150.00)
2004 2.0 1.2 $795.00 $1,908.00 $610.56 $0.00 $133.90 $476.66
1.00 ($150.00)
1.00 $476.66
0.17 $84.90
0.03 $15.12
0.00 $2.69
0.00 $0.48
0.00 $0.09
0.926
0.857
0.794
0.735
0.681
0.630
$441.35
$72.78
$12.00
$1.98
$0.33
$0.05
2004 2.0 1.3 $795.00 $2,067.00 $661.44
2005 2.0 1.3 $842.70 $2,191.02 $701.13
2006 2.0 1.3 $893.26 $2,322.48 $743.19
2007 2.0 1.3 $946.86 $2,461.83 $787.79
2008 2.0 1.3 $1,003.67 $2,609.54 $835.05
2009 2.0 1.3 $1,063.89 $2,766.11 $885.16
$133.90
$137.92
$142.05
$146.32
$150.71
$155.23
$8.96 $518.58
$9.23 $553.98
$9.50 $591.64
$9.79 $631.68
$10.08 $674.27
$10.38 $719.55
$150.00
1.000 ($150.00) $378.49
2003
2005 2.0 1.2 $842.70 $2,022.48 $647.19 $0.00 $137.92 $509.28
2006 2.0 1.2 $893.26 $2,143.83 $686.03 $0.00 $142.05 $543.97
2007 2.0 1.2 $946.86 $2,272.46 $727.19 $0.00 $146.32 $580.87
2008 2.0 1.2 $1,003.67 $2,408.81 $770.82 $0.00 $150.71 $620.11
2009 2.0 1.2 $1,063.89 $2,553.33 $817.07 $0.00 $155.23 $661.84
$150.00
($150.00) 1.00
1.00
0.22
0.05
0.01
0.00
0.00
($150.00) 1.000 ($150.00) $461.09 $82.60 $9,498,542 $29,682,943
$518.58
$120.04
$27.78
$6.43
$1.49
$0.34
0.926
0.857
0.794
0.735
0.681
0.630
$480.17
$102.92
$22.05
$4.72
$1.01
$0.22
Related Documents 543cg
Rosewood Case Spreadsheet 4e3b6v
November 2021 0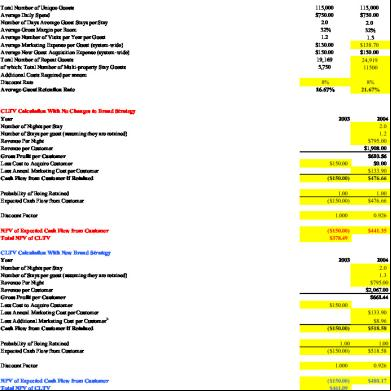
Rosewood Case Spreadsheet 4e3b6v
November 2021 0
Rosewood Hotel Case Study 2r2m6j
October 2019 52
Business Case Spreadsheet Irr 6b342d
December 2019 47
Rosewood Hotels And Resorts- Case Analysis 5e4h6w
January 2022 0