Physical, Chemical And Biological Characteristics Of Wastewater 47701z
This document was ed by and they confirmed that they have the permission to share it. If you are author or own the copyright of this book, please report to us by using this report form. Report l4457
Overview 6h3y3j
& View Physical, Chemical And Biological Characteristics Of Wastewater as PDF for free.
More details h6z72
- Words: 1,841
- Pages: 45
INTRODUCTION: WW CONSTITUENTS AND REGULATIONS
THE HYDROLOGIC CYCLE AND WATER QUALITY • Water - cover ¾ of the earth surface • Over 97% of the total water is not readily usable – oceans and other saline bodies of water • Over 2% is inaccessible – ice caps and glaciers, atmospheric and soil moisture • Only 0.62% for human – fresh water lakes, rivers & groundwater supplies
HYDROLOGIC CYCLE Atmosphere Condensation
Evaporation
Evapotranspiration
Earth’s surface
Surface runoff Percolation
Ground water flow
IMPURITIES IN WATER 1. Surface, or nuclei during condensation 2. Liquid water travels through the remainder of the hydrologic cycle – with other material in air or earth 3. Human activities – industrial and domestic waste * Impurities can be both in suspended and dissolved form
WATER QUALITY • Predicted on the intended use of the water • Water pollution – defined as the presence in water of impurities in such quantity and of such nature as to impair the use of the water for a stated purpose • Standard method – analytical procedures to measure the impact of impurities on water
WASTEWATER CONSTITUENTS • Predicted on the intended use of the water • Water pollution – defined as the presence in water of impurities in such quantity and of such nature as to impair the use of the water for a stated purpose • Standard method – analytical procedures to measure the impact of impurities on water
WASTEWATER CONSTITUENTS
1. SUSPENDED SOLIDS SOURCES Natural contaminants resulting from the erosive action of water flowing over surfaces Result from human use of water – domestic wastewater Contain inorganic (clay, silt) or organic (plant fibers, bacteria)particles, immiscible liquids (oil and grease)
IMPACT Aesthetically displeasing Provide adsorption site for chemical and biological agents May be degraded biologically or may include diseases-causing organisms MEASUREMENT Filtering the water, drying the residue and filter to a constant weight at 104oC and lastly determine the mass of the residue retained on the filter
• •
FILTERABLE RESIDUE AND NONFILTERABLE RESIDUE Term used in laboratory analysis to represent the SS and DS Filterable residue closely related to DS while nonfilterable residue more closely to SS USE Measure the quality of wastewater influent Monitor several treatment processes Measure the quality of the effluent
2. TURBIDITY • A measure of the extent to which light is either absorbed or scattered by suspended material in water • Not a direct quantitative measurement of SS SOURCES results from the erosion of colloidal material such as clay, silt, rock fragments, metal oxides from the soil, vegetables fiber, microorganism, soaps, detergent, emulsifying agents
IMPACT Aesthetically displeasing opaqueness will appear Provides adsorption sites for chemicals and biological organism that may be harmful or cause undesirable tastes and odors May interfere with light penetration and photosynthetic reactions in streams and lakes
MEASUREMENT Measured photometrically by determining the percentage of light of a given intensity that is either absorbed or scattered Turbidity is a relative measure, not absolute measures. It is usually expressed as nephelometric turbidity units (NTU) or as metres depth. Other units, formazin turbidity units (FTU) or Jackson turbidity units (JTU)
Turbidimeter using the scattered/transmitted light method
USE Made on ‘clean’ waters
3. COLOR • Apparent color – color of water partly due to suspended matter • True color – color contributed by DS SOURCES Yellowish-brown – water with organic debris Reddish – cause by iron oxide Brown/blackish – manganese oxide Industrial waste – textile and dyeing operations, food processing
IMPACT Unsuitable for laundering, dyeing, papermaking, dairy production Affect the market of domestic and industrial company Organic compound – reduce the effectiveness of chlorine as disinfectant MEASUREMENT Comparison with standardized colored materials (unit used TCU)
4. TASTE & ODOR SOURCES Mineral, metals and salts from the soil end products from biological reactions Inorganic substances – taste Alkaline material & metallic salts cause a bitter taste to water Organic material – contributed to both taste and odor
IMPACT Consumer associates T&O with contamination Organic substances – carcinogenic MEASUREMENT Can be made if the causative agents are known Organic cause – gas or liquid chromatography Qualitative test – threshold odor number (TON)
TON = (A + B)/A Where A = volume of odorous water (mL) B = volume of odor-free water required to produce a 200-mL mixture USE Serves as guideline for potable water TON of 3 recommended by the Public Health Service
5. TEMPERATURE Algae growth higher in warm water, causes algae mats – secrete oil and dead algae will causes taste & odor prob.
Affect solubilities of gases in water
Affect chemical reaction rate
IMPACT OF TEMPERATURE
Physical properties e.g viscosity and density – affect planktonic microorg.
Biological activities higher in higher T
CHEMICAL WATER QUALITY PARAMETERS
1. TDS
• Materials remaining in water after SS removal • Organic sources – decayed product of vegetation, organic chemical • Inorganic sources – minerals, metals, gases • Produce undesirable substances in water (color, taste, odor, toxicity problem) • Some are essential: distilled water taste flat, readily dissolved added to pure water to reduce its tendency to dissolve pipes and plumbing
2. ALKALINITY
• The ability of water to neutralize acids (quantity of ions that can neutralize H +) • Ions sources – dissolution of mineral substances in soil and atm (CO32-, HCO3-, OH-, NH3 etc) - HPO42- from detergent, fertilizers and insecticide - HS- and NH3- from byproduct of decomposition of organic material
3. HARDNESS • Amount of multivalent metallic cation in water – Sum of Ca & Mg ions in water – Other ions very little – Fe, Mn IMPACT
• Soap consumption higher • Form precipitation with soap – sticks to surface of sinks, dishwasher, rough skin, stain clothes • Economic loss: fouling of water heaters and boilers
4. FLUORIDE • Appears in groundwater in few geographical regions • Toxic in high conc, beneficial in low conc – 1 mg/L help prevent dental cavities, stronger teeth – >2 mg/L discoloration of teeth (mottling) – Higher conc – bone fluorosis
5. METALS NONTOXIC METAL • If exist in small amount – Zn, Fe, Mn, Al • Ca and Mg – hardness ions • Na – most common TOXIC • Mining and industrial industry • Ar, Ba, Cd, Pb, Hg – goes up food chain, greatest danger to top of chain MEASUREMENT – by AAS
6. NUTRIENTS • Nitrogen is often the limiting nutrient in ocean waters and some streams • Can exist in numerous forms, but most common are nitrate, nitrite, ammonia • Sources are primarily from fertilizers and acid deposition
• Phosphorus is typically the limiting nutrient in lakes and algae growth is linked to phosphorus inputs • Problems – Taste and odor in drinking water – Can be toxic, especially to farm animals – Fouling – Diurnal DO cycles
• Sources – fertilizers and detergents • Can exist in a variety of chemical forms, so total P is normally measured
7. ORGANICS • Soluble in water • Obtained from natural sources and human activities • Categories of dissolved organic – Biodegradable – Nonbiodegradable
7.1 BIODEGRADABLE ORGANICS • Consist of organics that can be utilized for food by naturally occurring microorg within a reasonable length of time • Organic material exist in dissolved from - starches, fats, proteins, alcohols, acids, aldehydes and esters • Microbial utilization involved oxidation (more efficient) and reduction
• BOD – the amount of O2 consumed during microbial utilization of organics (how much available O2 is used by bacteria to decay organic matter in the water) • BOD test: determine the O2 consumed from a sample placed in an airtight contained in controlled environment fro selected time. • Standard – 300 ml bottle, incubated at 20oC, 5 days in dark room (prevent algae growth – produce O2)
BOD CALCULATION
• Where DOi = initial DO (mg/L) DOf = final DO (mg/L) P = decimal fraction of sample in 300 mL bottle
BOD FROM SEWAGE TREATMENT PLANT IN MALAYSIA (2006) State
No. of STP
Total PE
Flow (m3/day)
BOD Load (kg/day)
Selangor
2,563
5,908,450
1,329,401
332,350.31
Perak
1,343
1,300,430
292,597
73,149.19
Johor
1010
1,198,417
269,644
67,410.96
Negeri Sembilan
928
931,458
209,578
52,394.51
Kedah
755
556,637
125,243
31,310.83
Melaka
725
570,192
128,293
32,073.30
Pulau Pinang
650
2,149,001
483,525
120,881.31
Pahang
486
314,830
70,837
17,709.19
WP Kuala Lumpur
299
2,571,877
578,672
144,668.08
Terengganu
224
75,184
16,916
4,229.10
Perlis
36
16,156
3,635
908.78
WP Labuan
32
39,265
8,835
2,208.66
9
72,833
16,387
4,096.86
9,060
15,704,730
3,533,563
883,391.08
WP Putrajaya Total
Example 1: Determining BOD5 The BOD of w/water is suspected to range from 50 to 200 mg/L. Three dilutions are prepared to cover this range. The procedure is the same in each case. First the sample is placed in the standard BOD bottle and is then diluted to 300 mL with organic-free, oxygen-saturated water. The initial DO is determined and the bottles tightly stoppered and placed in the incubator at 20oC for 5 days, after which the DO is again determined. Given:
Wastewater, L DOi (mg/L)
DOf (mg/L)
0.005
9.2
6.9
0.010
9.1
4.4
0.020
8.9
1.5
7.2 NONBIODEGRADABLE ORGANIC • Some organics materials are resistant to biological degradation – tannic and lignic acid, cellulose,phenols • Polysaccharides (strong bond) and benzene (ringed struct) are also nonbiodegradable e.g detergent compound ABS • Insecticide, herbicide, pesticide accumulate to top food chain, can cause extinction of animal species
BIOLOGICAL WATER QUALITY PARAMETER • All of biological community are water quality parameters 1. PATHOGEN • Organism capable of infecting, or transmitting disease to human • Usually require an animal host for growth and reproduction • Can be transported by natural water systems • Include bacteria, viruses, protozoa and helminths (parasitic worm)
1.1 BACTERIA
•Diseases causes by bacteria – gastrointestinal disorder, cholera, typhoid
1.2 VIRUSES
• Diseases – disorder of the nervous system, poliomyelitis, infectious hepatitis
1.3 PROTOZOA
• Diseases – dysentery, malaria
1.4 HELMINTHS
• Serious case of liver, intestine and urinary system
WATER QUALITY REQUIREMENTS • Vary according to the proposed use of the water • Represent a known/assumed need & based on prior experience of the water • WQS – set by government
WATER QUALITY STANDARDS • Standards
RIVER WATER QUALITY MONITORING • • • • • • •
BOD COD Ammonical nitrogen pH DO SS Optional – heavy metals and bacteria
WATER QUALITY INDEX • Give info on water quality conditions & trends • To measure the degree of water pollution and a tool in water quality classification • Reflect changes in physio-chemical quality of surface water & indicator of ecological change • Easiest method to explain the pollution level of water esp to public – using ranges between excellent, good, medium, bad and very bad
WQI - continuous • Is used to relate a group of variables to a common scale • Varies with changes in parameters values that would be indicative of changes in the quality of waters • WQI system and parameters vary from country to country • Measures general water quality conditions and does not reflect the presence of toxic compounds or specific toxic conditions
Related Documents 543cg
Physical, Chemical And Biological Characteristics Of Wastewater 47701z
December 2019 57
Physical And Chemical Incompatibilities 2c6h4l
October 2019 44
Physical And Chemical Changes 3j1f5g
November 2019 47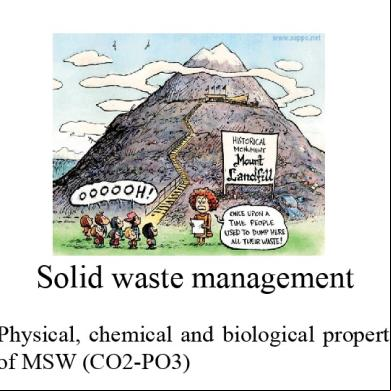
Sw_physical, Chemical And Biological Properties Of Msw_ilearn 45j4f
November 2019 38
Biological Wastewater Treatment, 2nd Edition 153l1s
October 2019 174
Biological Wastewater Treatment - Principles Modelling And Design 3w3g6y
December 2019 253More Documents from "Norzaifee Nizamudin" 445v1g
Physical, Chemical And Biological Characteristics Of Wastewater 47701z
December 2019 57
3. Chemical Design Heat Exchanger Latest 1s6n3g
April 2020 21